Predicting Tides (TypeScript)
Table of Contents
Intro
Once upon a time we had the idea of creating a tide clock for our camper van. My wife preferably flies her drone at low tide (bonus if this is a sunset), because of all the beautiful rock formations and pools being revealed.
Of course, it is easy to look up tides online, but we thought it would be convenient to have a tide clock in our van so we can see with a glimpse when the low tides will be that day.
Initially, we both remembered that tides repeat about every 12h25min, so it should be pretty easy to figure out our offset via GPS and we’re good to go… Wrong:
Not that simple.
The question now is: What is the magic behind estimating tides? (This is the point where it helps to be interested in maths, and not immediately give up 😉)
If you want to know about the history of tidal physics, we recommend reading the wikipedia article. There have been some very interesting approaches to estimating tides.
I will concentrate on one of the latest approaches that is still maintenanced by the European Commission Joint Research Centre.
The Repo
TL;DR: https://github.com/pauls-3d-things/tide-estimation
The Math
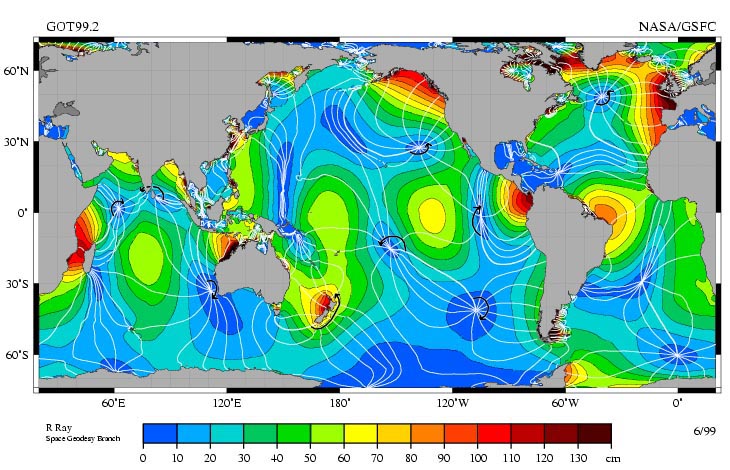
Every location at the coast has it’s own tides. As you can see in the picture above, the coastline, location on the planet, nearby oceans and currents all influence the tides at a given location.
Thus, as each location has it’s own rhythm. The goal now is to analyze this rhythm, derive the parameters to describe it, so we can use this rhythm to predict future values.
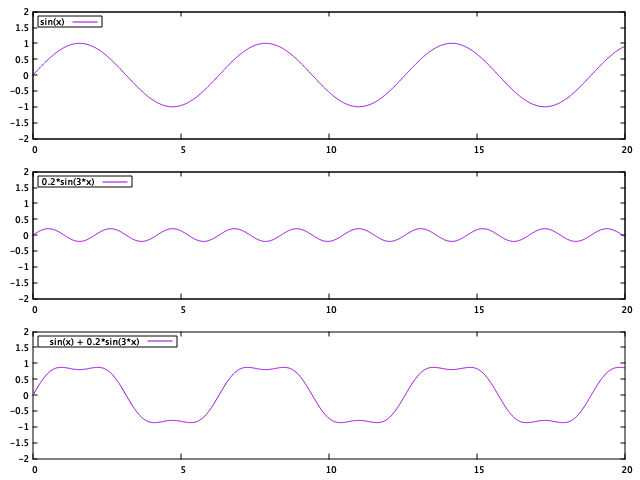
sin(x), 0.2*sin(3*x) and the addition of both sin(x) + 0.2*sin(3*x).In the same way, tides are composed of multiple signals. In the case of tide prediction we need to reverse this first, this means to split it into separate signals and obtain the single components of each (In this example
(1,1) and (0.2,3)).
The components used to describe the rhythm of a tide are called Harmonics Constants. We can use these to fill a function with parameters and calculate the height of the tide at a given point in time. You can find the details in this paper: Continuous Harmonics Analysis of Sea Level Measurements, by Alessandro Annunzia and Pamela Probst.
The function for Tide Estimation they provide is given as follows:
where σn = 2π / Hn.
This, means we “only” need the harmonic constants for a location…
| Comp # | Hn (day) | An (m) | Bn (m) |
|---|---|---|---|
| 0 | 0.00000 | 4.98798E+0 | 0E+0 |
| 1 | 0.12877 | -1.37513E-4 | -4.0392E-3 |
| … | … | … | … |
…and a code snipped (they provided) to do the estimation:
double EstimateTideValues() {
    double Pi = Math.PI;
    double sum = harmonics[0, 1];
    for (int k=1; k <= harmonics.GetUpperBound(0); k++) {
        double period = 2 * Pi / harmonics[k, 0];
        double coefCos = harmonics[k, 1];
        double coefSin = harmonics[k, 2];
        sum += coefCos * Math.Cos(time * period);
        sum += coefSin * Math.Sin(time * period);
    }
    return sum;
}
Obtaining Harmonics
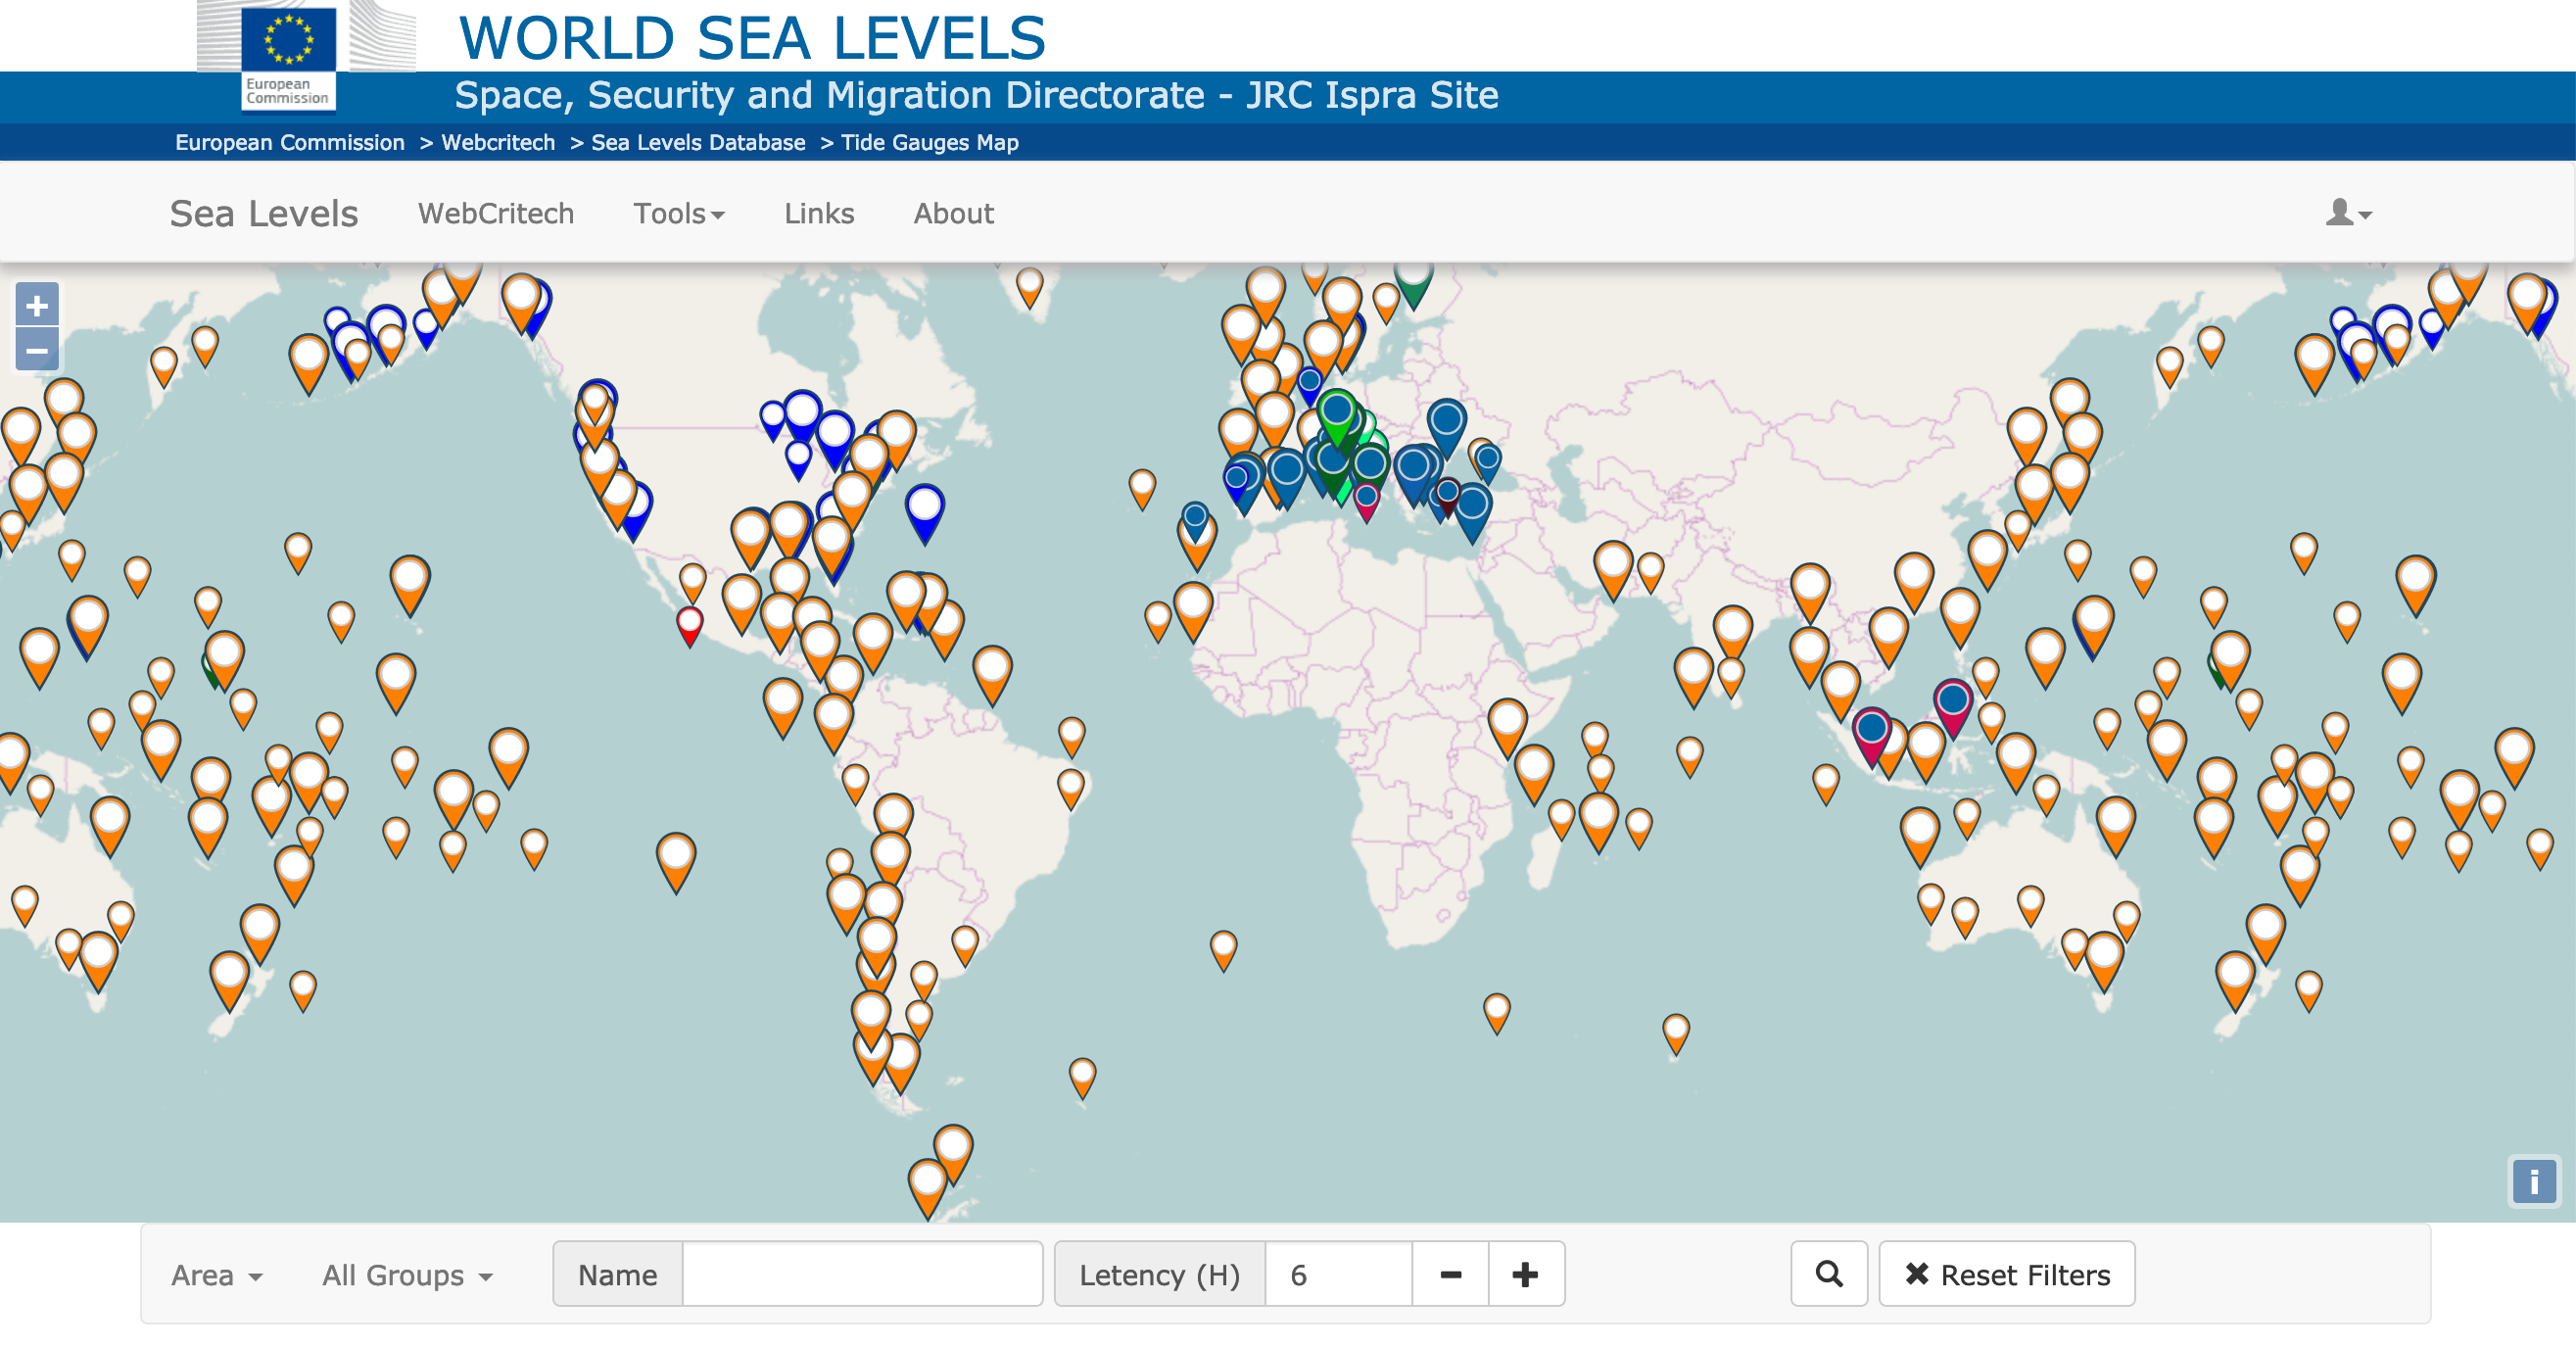
The European Commission Joint Research Centre provides a web interface to query the parameters for a given location (id):
http://webcritech.jrc.ec.europa.eu/worldsealevelinterface/Default.aspx
Example http://webcritech.jrc.ec.europa.eu/worldsealevelinterface/?id=1495:
# Search result for buoy Id = 1495
# ID=1495
# name=France - Boulogne-Sur-Mer
# latitude=50.7270011901855
# longitude=1.57700002193451
# mult x=1
# mult y=1
# offset x=0
# offset y=0
# MovAvg=-1
# Harmonics=HARMONICS_WE:0,4.98801394719323,0|[...]|365.259977441544,0.0357685300102641,-0.0610679841616988|
# label=
# url=http://www.ioc-sealevelmonitoring.org/service.php?query=data&format=xml&code=boul
# lastData = 10 Mar 2019 13:47:25 (OK, 38 min ago)
# Request date (UTC)=10 Mar 2019 14:25:57
# Time(UTC), Wat Level (m)
09/03/2019 14:26:26, 8.044
[...]
If you look at the response we are interested in the # Harmonics=HARMONICS_WE: line.
To extract the values and convert them into an array of numbers we can do the following:
import fetch from 'node-fetch';

export const fetchHarmonics = (id: string) => {
    return fetch("http://webcritech.jrc.ec.europa.eu/worldsealevelinterface/?id=" + id)
        .then(result => result.text())
        .then((text: string) => {
            const data = text.split('\n')
                .filter(line => line.startsWith("# Harmonics="))[0]
                .split(':')[1]; // remove line header # Harmonics=HARMONICS_WE:
            const harmonics = data.split('|') // separate tuples
                .filter(e => e.trim().length > 0) // remove empty values (last)
                .map(entry => entry.split(',') // separate values
                    .map(n => parseFloat(n)));
            return harmonics;
        });
}
The Code
To test the tide estimation, we translated their example code to TypeScript:
export type TideEstimator = (harmonics: number[][], time: number) => number;

export const estimateTide: TideEstimator = (harmonics: number[][], time: number) => {
    const Pi: number = Math.PI;
    let sum: number = harmonics[2][0]; // A_0
    for (var k = 1; k <= harmonics[0].length - 1; k++) {
        var period: number = 2.0 * (Pi / harmonics[1][k] /* H_k */);
        var coefCos: number = harmonics[2][k]; // A_k
        var coefSin: number = harmonics[3][k]; // B_k
        sum += coefCos * Math.cos(time * period);
        sum += coefSin * Math.sin(time * period);
    }
    return sum;
}
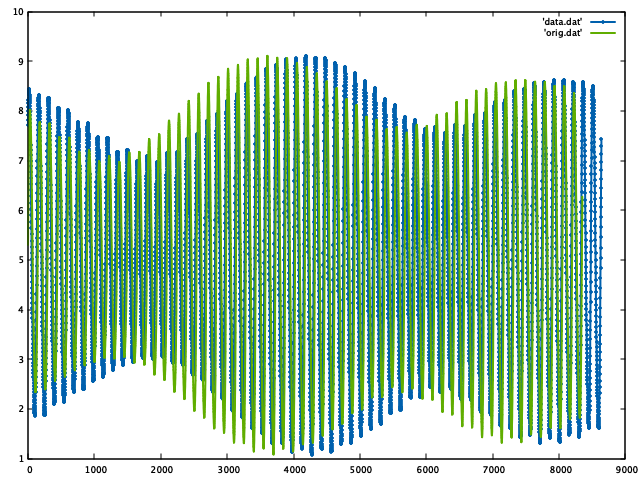
Using this tool you can play around with their datasets and predicted values.
We wrote a script to download the predicted values, the harmonics, then do the offline calculations and compare the results. We did this, because we had some trouble getting correct values, because t* was not “the time in s since 1900”, but rather time in days since “1899-12-30T00:00:00Z” (wtf?):


If you are one of the original developers, do you have an idea why there is an offset of a day?