Howto draw ui elements with U8G2
This post shows you how to draw simple UI elements with U8G2 for your embedded project.
Table of Contents
The Intro
This post is aiming at beginners. To see the results you can go to https:///u8g2sim/, then > Code Examples > UI Elements.
In this post we will look at creating UI elements procedurally, which means in this case, not using any images, bitmaps or similar.
The graphics library of my choice for this is https://github.com/olikraus/u8g2, as it supports a lot of displays and has a nice API.
Taking things appart
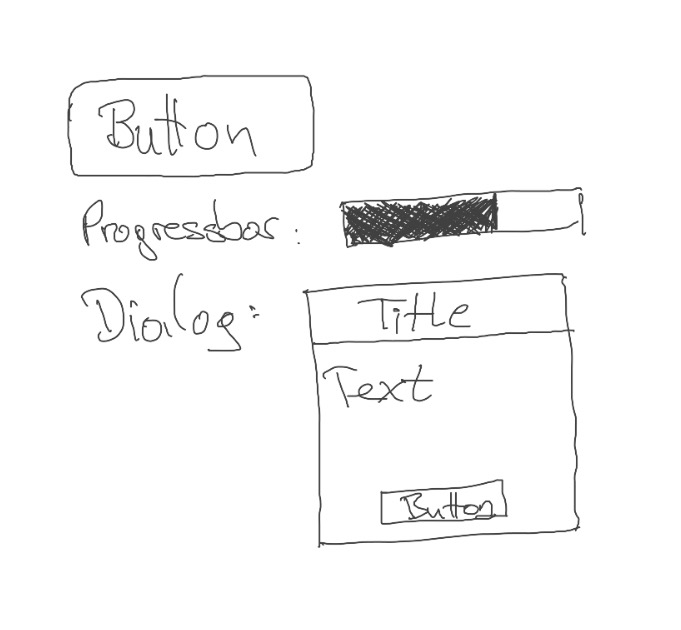
You can draw a button, a progress bar or even a simple dialog without any problems.
When you want to draw simple UI elements on a tiny display, you will need to do the same. First in your head, and then translate this into code, and see what happens.
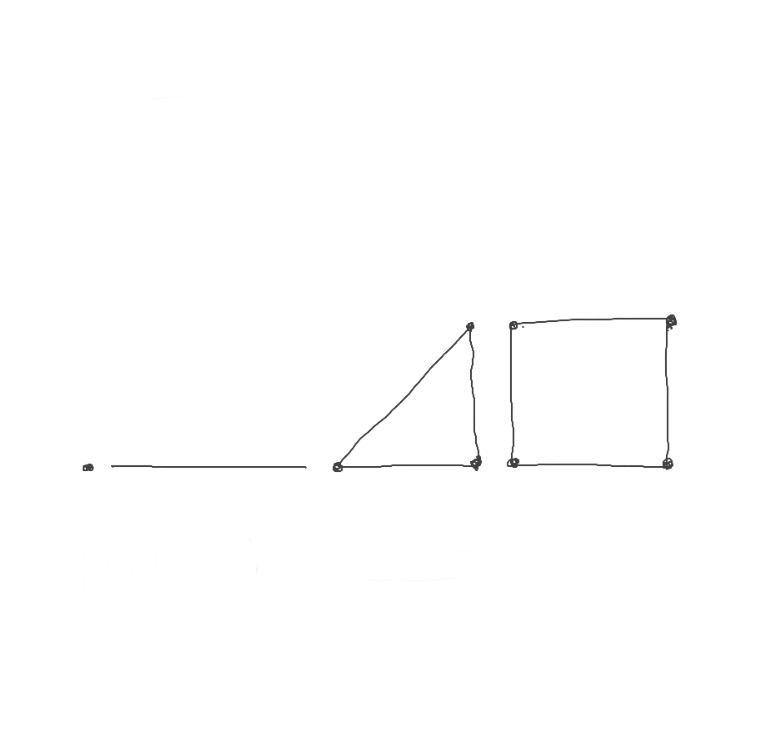
You will need to destroy your UI component into pixels, lines, arcs or circles. These will be our atoms and elements out of which our components will be made of.
The smalles thing we can draw is a pixel. If you extend this pixel into one direction you will get a line. With lines we can play around and draw triangles and squares, or in general: polygons.
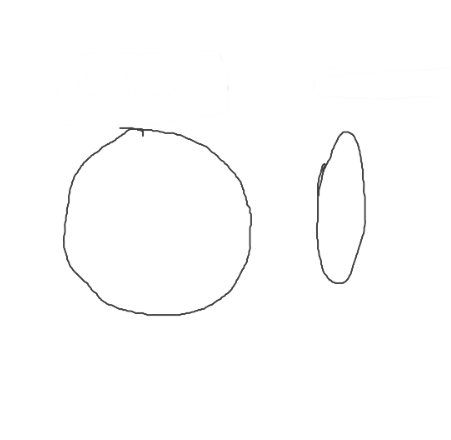
Another prominent example is the circle and the ellipse.
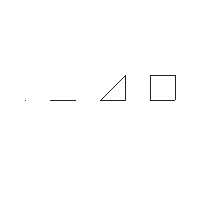
Below is the code that generates the example shown above. As you can see, the library u8g2 provides functions to draw basic graphical elements:
void draw(U8G2 u8g2) {
    u8g2.setDrawColor(1);

    // x1,y1
    u8g2.drawPixel(25, 100);

    // x1,y1, x2,y2
    u8g2.drawLine(50,100,75,100);

    // x1,y1, x2,y2, x3,y3
    u8g2.drawLine(100,100,125,100);
    u8g2.drawLine(125,100,125,75);
    u8g2.drawLine(125,75,100,100);
    // u8g2.drawTriangle(100,100, 125,100, 125,75); // this is filled

    // x,y,w,h   origin: top left
    u8g2.drawFrame(150,75,25,25);
 }
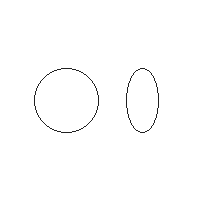
see the code example below:
void draw(U8G2 u8g2) {
    u8g2.setDrawColor(1);

    // x1,y1, radius
    u8g2.drawCircle(66, 100, 32);

    // x1,y1, x-width, y-width
    u8g2.drawEllipse(142,100,16,32)
 }
You can try the code examples on this page in my simulator, and change them to get to know the functions.
Next, let’s take a look at the available draw functions of u8g2:
| Trivial | Rectangular | Round | Text/Other |
|---|---|---|---|
drawPixel |
drawFrame |
drawDisc |
drawGlyph |
drawLine |
drawRFrame |
drawCircle |
drawStr |
drawHLine |
drawBox |
drawEllipse |
drawUTF8 |
drawVLine |
drawRBox |
drawFilledEllipse |
drawXBM |
drawTriangle |
You can look up the references here: https://github.com/olikraus/u8g2/wiki/u8g2reference
Putting things together
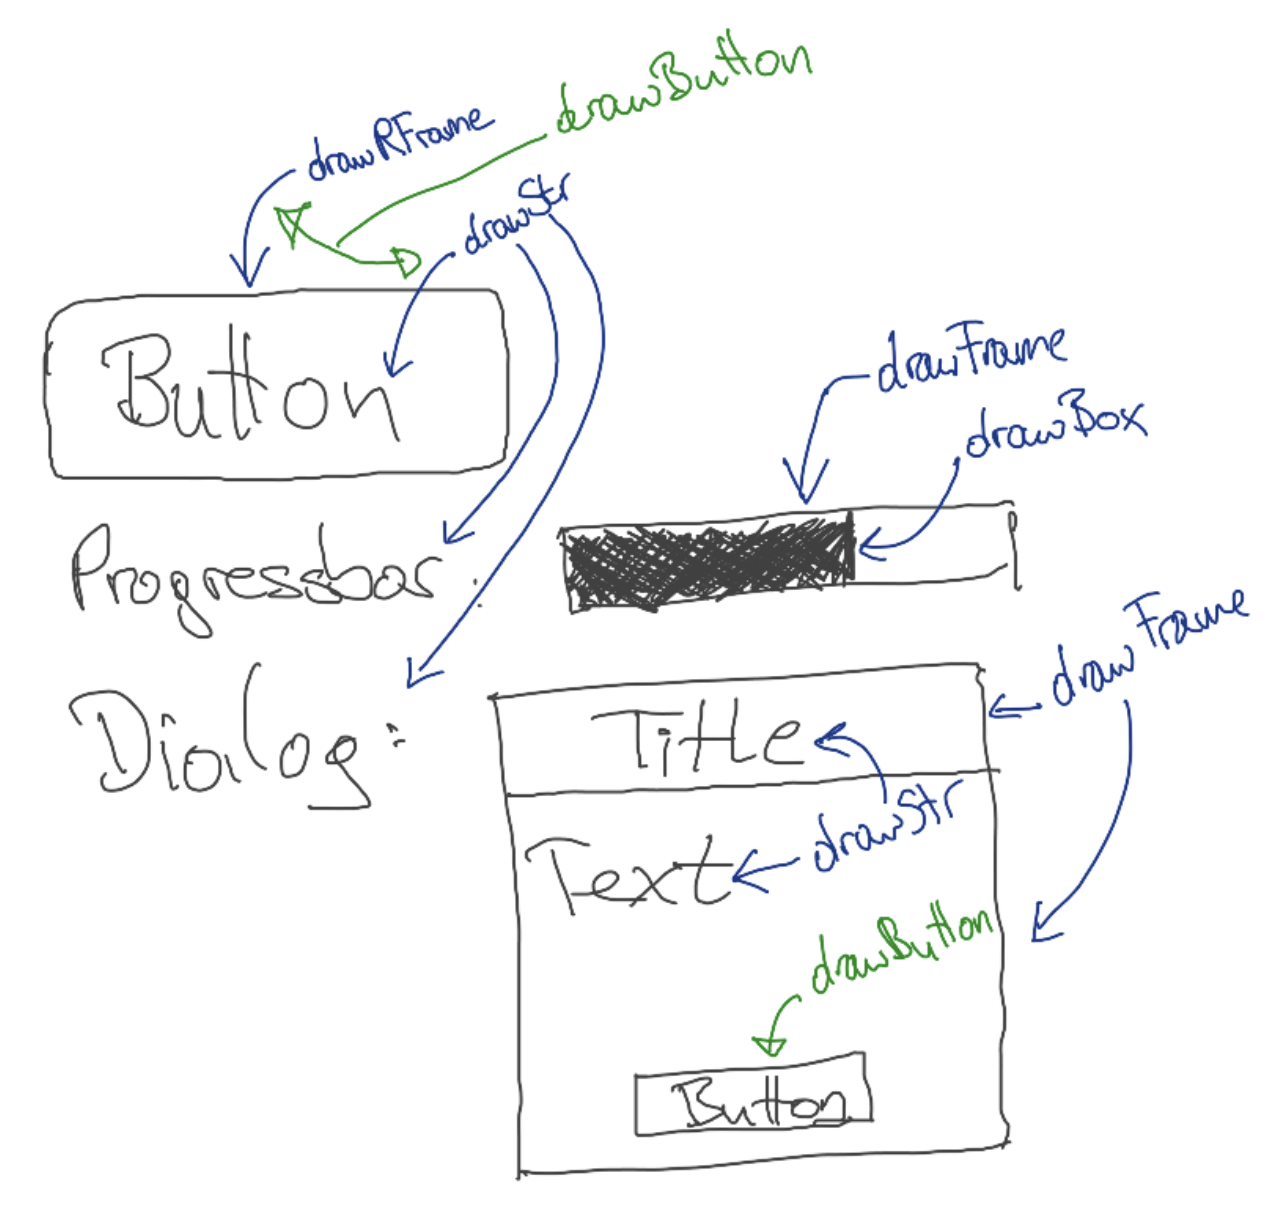
Then, we can translate this into code.
The code below reads as follows: we define three functions, namely button, progressbar and dialog, which we call from within draw to recreate our initial sketch.
Also, we make use of the helper functions getMaxCharHeight and getMaxCharWidth from u8g2, so we can use these to calculate the centered position of the text.
void button(U8G2 u8g2, int x, int y, int w, String str) {
    u8g2.setFont(u8g2_font_5x8_tf);
    u8g2.drawRFrame(x, y, w, u8g2.getMaxCharHeight() + 6, 4);
    int centeredX = x + (w / 2) - ((str.length() * (u8g2.getMaxCharWidth())) / 2);
    int centeredY = y + u8g2.getMaxCharHeight() + 2;
    u8g2.drawStr(centeredX, centeredY, str.c_str());
}

void progressbar(U8G2 u8g2, int x, int y, int w, int h, float value) {
    u8g2.drawFrame(x, y, w,  h);
    u8g2.drawBox(x + 2, y + 2, (w - 4) * value,  h - 3);
}

void dialog(U8G2 u8g2, uint8_t x, uint8_t y, uint8_t w, uint8_t h, String title, String msg, String btn) {
    u8g2.setFont(u8g2_font_5x8_tf);
    u8g2.drawFrame(x, y, w, h);
    u8g2.drawFrame(x, y, w, u8g2.getMaxCharHeight() + 2);

    int centeredX = x + (w / 2) - ((title.length() * (u8g2.getMaxCharWidth())) / 2);
    int centeredY = y + u8g2.getMaxCharHeight();
    u8g2.drawStr(centeredX, centeredY, title.c_str());

    int offsetY = y + u8g2.getMaxCharHeight() * 2 + 4;
    u8g2.drawStr(x + 2 , offsetY, msg.c_str());

    button(u8g2, x + w / 4, y + h - 16, w / 2, btn);

}

void draw(U8G2 u8g2) {
    u8g2.setDrawColor(1);

    button(u8g2, 25,50, 50,"Button");

    u8g2.setFont(u8g2_font_5x8_tf);
    u8g2.drawStr(25, 75, String("Progressbar:"));
    u8g2.drawStr(25, 100, String("Dialog:"));

    progressbar(u8g2, 100, 65, 80, 16, 0.6); // value: 0.0 - 1.0

    dialog(u8g2, 80,100, 80, 60, String("Title"), String("Text"), String("Button"));
}

The result of the code above.
(Which looks a lot better than our initial sketch).
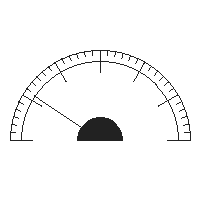
Adding Complexity
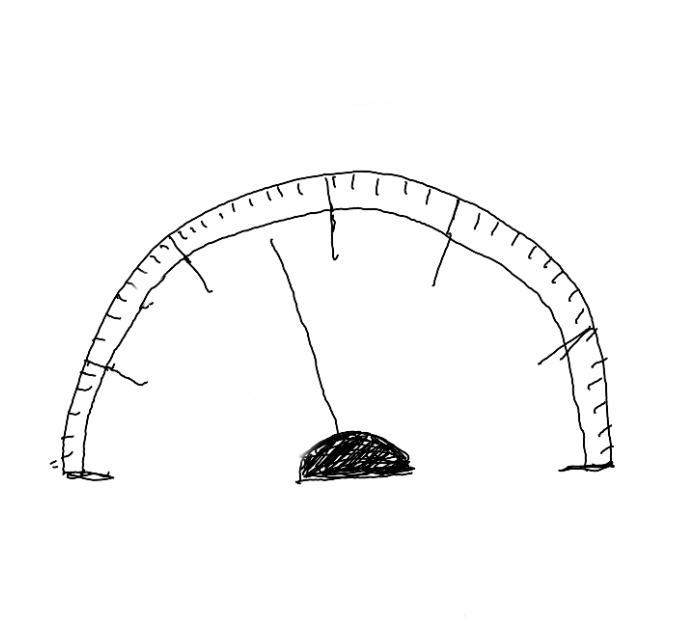
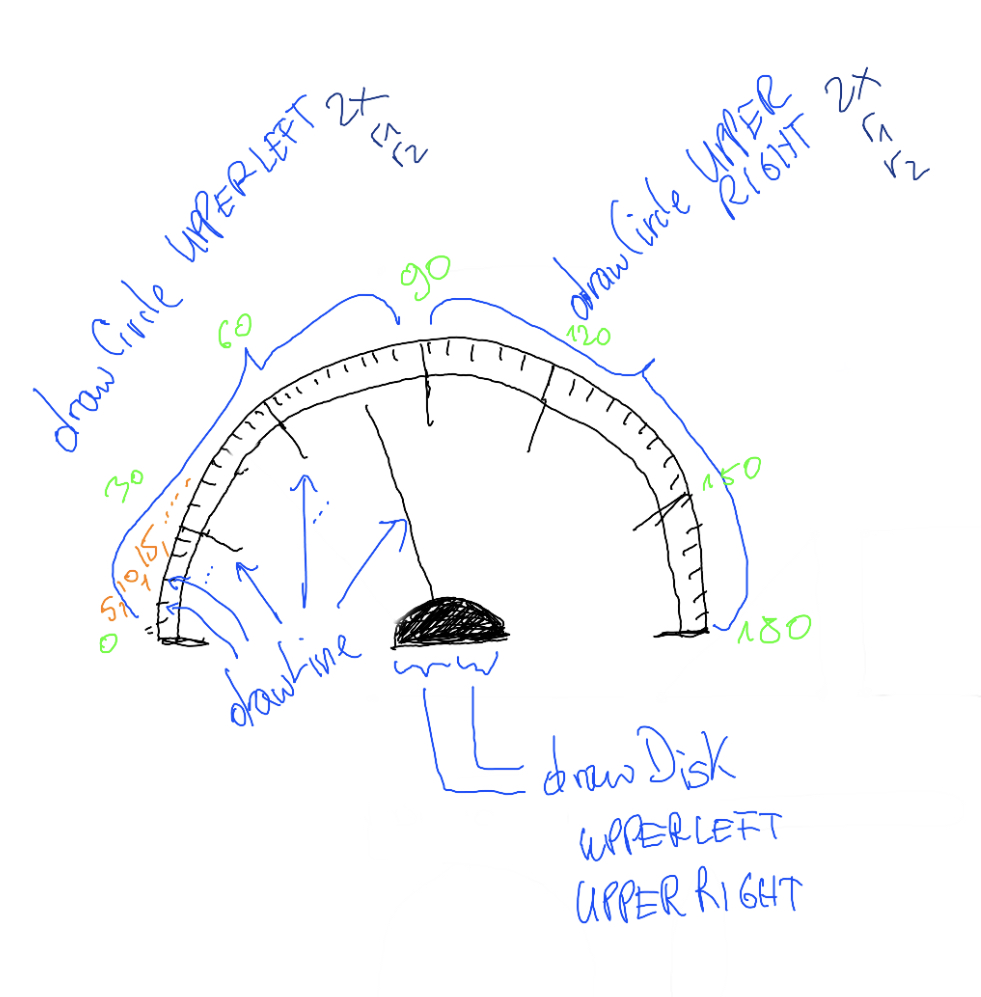
The trickiest part will be the rotation of the lines. ;)
void rotX(int cx, int r, int degrees) {
    return cx + (r - 2) * cos(2*PI * (degrees / 360) - PI);
}
void rotY(int cy, int r, int degrees) {
    return cy + (r - 2) * sin(2*PI * (degrees / 360) - PI);
}

void gauge(U8G2 u8g2, uint8_t x, uint8_t y, uint8_t r, uint8_t percent) {
    uint8_t rx = x + r;
    uint8_t ry = y + r;

    // draw the outer circle segments
    u8g2.drawCircle(rx, ry, r, U8G2_DRAW_UPPER_LEFT);
    u8g2.drawCircle(rx, ry, r, U8G2_DRAW_UPPER_RIGHT);
    u8g2.drawCircle(rx, ry, r - (r/8), U8G2_DRAW_UPPER_LEFT);
    u8g2.drawCircle(rx, ry, r - (r/8), U8G2_DRAW_UPPER_RIGHT);

    // draw the inner disc segments
    u8g2.drawDisc(rx, ry, r/4, U8G2_DRAW_UPPER_RIGHT);
    u8g2.drawDisc(rx, ry, r/4, U8G2_DRAW_UPPER_LEFT);

    // the needle
    uint8_t px = rotX(rx, r - r/8, percent);
    uint8_t py = rotY(ry, r - r/8, percent);
    u8g2.drawLine(rx, ry, px, py);


    // long ticks
    for (int n = 0; n <= 180; n+=30) {
        int x1 = rotX(rx, r, n);
        int y1 = rotY(ry, r, n);
        int x2 = rotX(rx, r - (r/4), n);
        int y2 = rotY(ry, r - (r/4), n);

        u8g2.drawLine(x1, y1, x2, y2)
    }

    // short ticks
    for (int n = 0; n <= 180; n+=5) {
        int x1 = rotX(rx, r, n);
        int y1 = rotY(ry, r, n);
        int x2 = rotX(rx, r - (r/16), n);
        int y2 = rotY(ry, r - (r/16), n);

        u8g2.drawLine(x1, y1, x2, y2)
    }
}

void draw(U8G2 u8g2) {
    u8g2.setDrawColor(1);
    gauge(u8g2, 10, 50, 90, counter % 180);
}
Explaining the rotation
The value we pass into cos and sin needs to be within 0.0 - 2*PI for a full rotation.
This means, we need to divide our degrees by 360. Then, we subtract PI to rotate our starting position to the 9 o’clock position (originally it is at 3 o’clock).
The reader has the liberty to create a generic helper function to draw ticks, instead of copy and pasting the for loop ;).